Debugging Nexodus
Tips and tricks to help you debug the various Nexodus components.
About Telepresence
Developing services deployed in Kubernetes can be tricky since it can be a bit slow to deploy changes into Kubernetes and even hard to remote debug. Telepresence allows you to reroute network traffic going in and out of a pod to your local machine so that you can more easily have a fast development loop of the software running in that pod.
Many of the tips in this document require you to first install telepresence. O
Debugging/Developing the apiserver
Once you have the Nexodus service running in Kind, run:
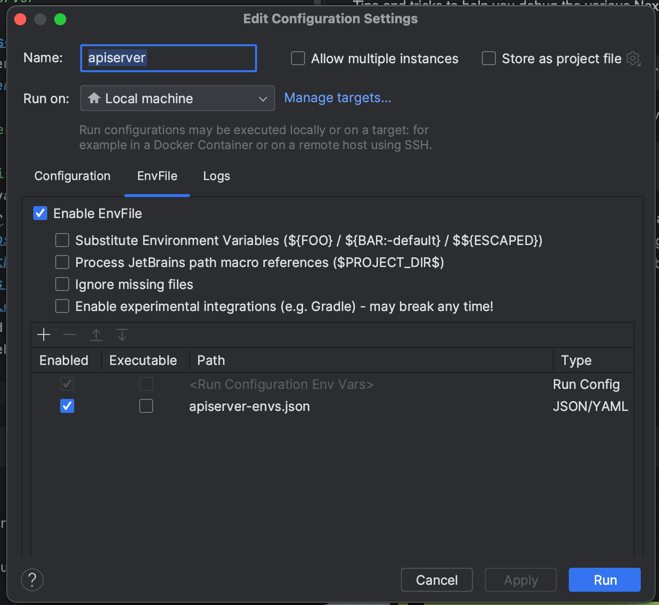
make debug-apiserver
This will create a apiserver-envs.json file that contains all the environment variables that you should set when your run the apiserver locally with a debugger. If your using an GoLand or IDEA ide, install the EnvFile Plugin. This will allow you automatically read and set the environment variables up when you launch and debug the api server.
Once you run the apiserver locally, requests against that Nexodus service should result in http requests being executed against your locally running apiserver.
To stop routing traffic from the apiserver pod to your machine, run:
make debug-apiserver-stop
Debugging/Developing the frontend
Once you have the Nexodus service running in Kind, run:
make debug-frontend
This will start a development vite server locally so that any local changes to the ui sources can instantly reloaded in your browser.
This uses Telepresence, so ignore the URLs on the screen from vite, and instead connect to https://try.nexodus.127.0.0.1.nip.io/
To stop routing traffic from the frontend pod to your machine, run:
make debug-frontend-stop
Profiling
Profiling nexd
To profile the performance of nexd, build it with pprof support enabled. If you run make all, you can use the dist/nexd-pprof binary. If you need to build for a specific and platform and architecture, you can set NEXODUS_PPROF=y and have pprof enabled in all binaries:
NEXODUS_PPROF=y make all
This also works for building the nexd container image.
NEXODUS_PPROF=y make image-nexd
Once pprof is enabled, nexd will expose performance data over http port 8088. To change this port, set the NEXD_PPROF_PORT environment variable.
To capture performance data and browse the results in a web interface, run this command:
go tool pprof -http=: http://<NEXD_HOST>:8088
A flame graph is available by navigating to View > Flame Graph in the web UI. Browse around for the other resources that are available.
Profiling the API server
To profile the performance of the Nexodus apiserver, build it with pprof support enabled. You can build the apiserver image with pprof support enabled by setting the NEXODUS_PPROF=y environment variable:
NEXODUS_PPROF=y make image-apiserver
To automatically build the apiserver image with pprof enabled and then deploy it to your development kind cluster, run:
NEXODUS_PPROF=y make redeploy
Once pprof is enabled, the apiserver will expose performance data over http port 8088. To change this port, set the NEXAPI_PPROF_PORT environment variable.
To capture performance data and browse the results in a web interface, run these commands to forward a port from the apiserver pod to your local machine and then connect to it to capture data:
kubectl port-forward -n nexodus deployment/apiserver 8088:8088 &
go tool pprof -http=: http://localhost:8088
A flame graph is available by navigating to View > Flame Graph in the web UI. Browse around for the other resources that are available.